
The electrocardiogram is a diagnostic test that provides information about the electrical activity of the heart.
A detailed description about what an electrocardiogram is has been discussed here. In this section, we explain the ‘waves’ that are seen on the electrocardiogram in a little more detail.
[toc]The normal ECG
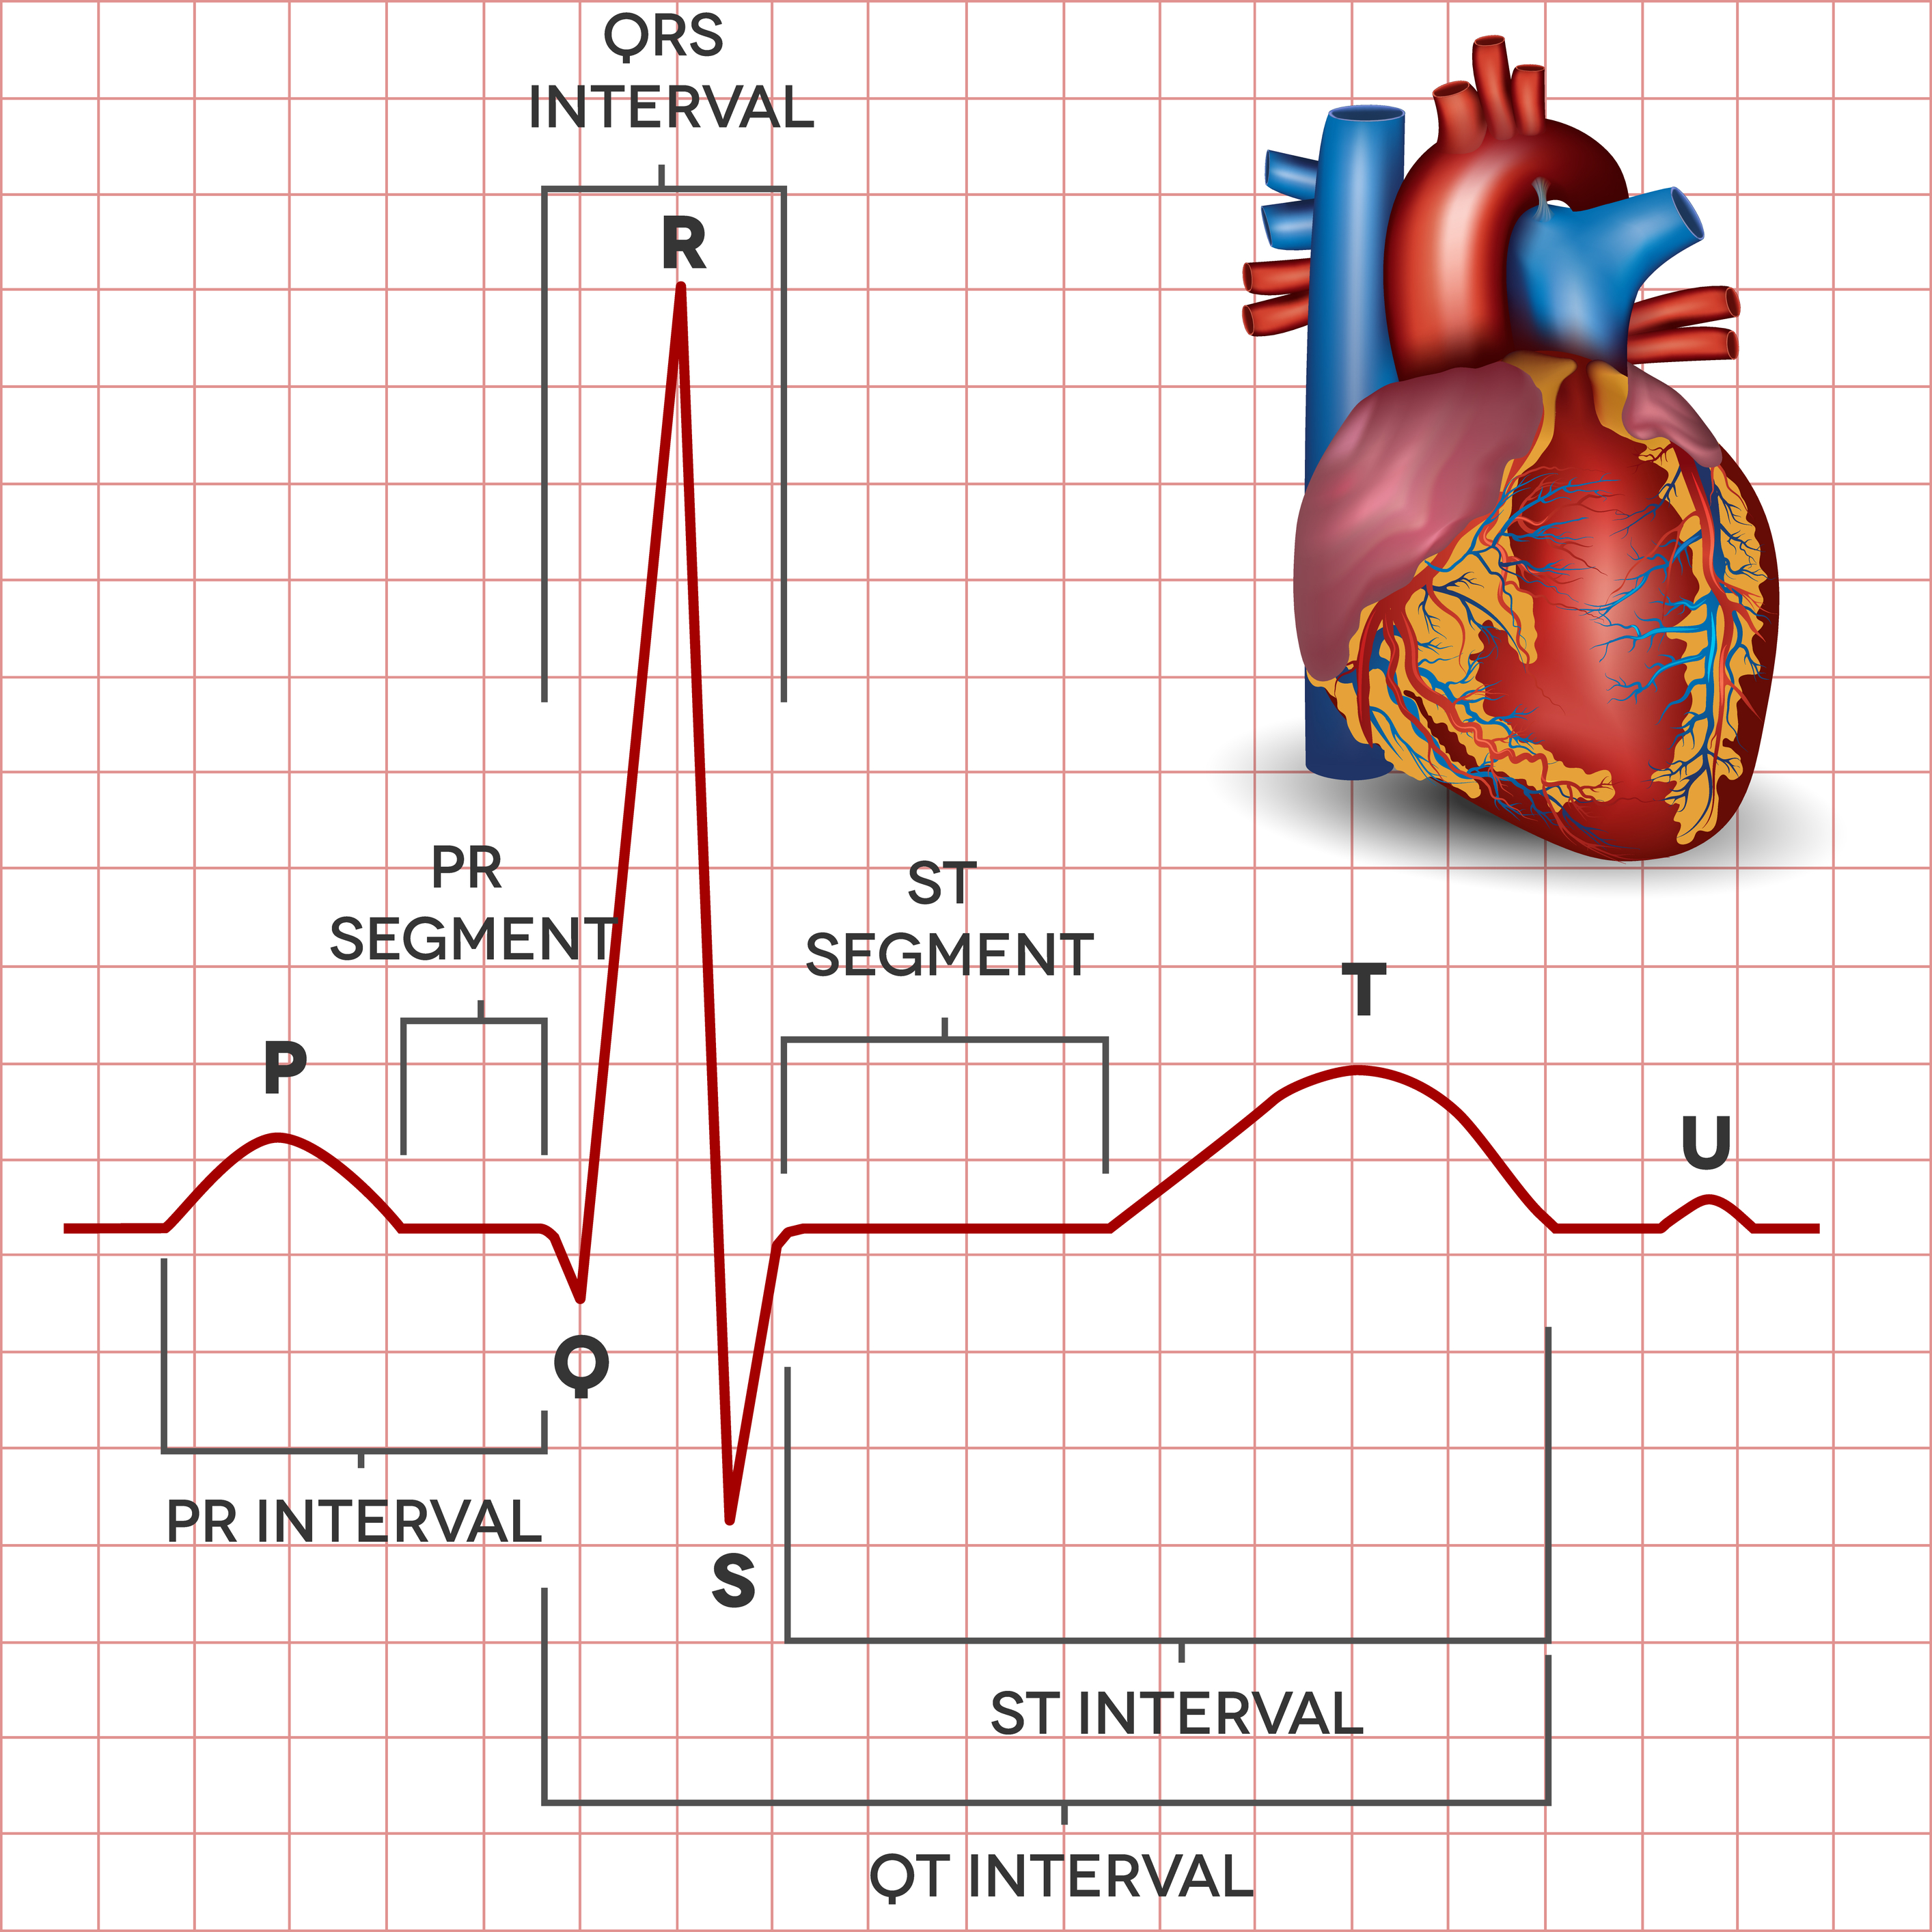
A normal electrocardiogram contains the following waves –
- P wave
- QRS complex
- T wave
- U wave (sometimes)
In between these waves are different ‘intervals’ –
- PR interval
- QT interval
- ST interval
There are also different ‘segments’ –
- PR segment
- ST segment
The image below clearly shows the different waves of the ECG. Lets now look at the important waves and segments.
1. P wave
This wave occurs due to contraction of the atrium (both right and left).
2. PR interval
This is the time interval between the end of the contraction of the atrium and the beginning of the contraction of the ventricle.
3. QRS complex
This represents the contraction of the ventricles. The Q wave is often very small, the R wave quite big (in comparison) and the S wave is relatively small.
4. ST segment
This segment corresponds to the time the contraction of the heart has concluded and the relaxation phase is about to begin. It is a very important part of the ECG, especially in patients who are suffering from chest pain or a heart attack.
5. T wave
This wave is representative of when the ventricle relaxes.
You may be wondering when the atrium relaxes. This occurs simultaneously with contraction of the ventricles. The wave is not seen on an ECG.
6. QT interval
This interval is the time period that includes contraction and relaxation of the ventricle. If it is prolonged significantly, it may result in irregular heart beats.
7. U wave
This rare wave is seen in patients who have low potassium levels in the blood. It could be seen in a normal ECG sometimes when the electrical activity reaches the papillary muscles.
Interpreting findings
Firstly, do not try and read an ECG looking at the image above. This is because every patient has a different looking ECG, meaning there can be numerous variations of what is considered ‘normal’.
Different changes in the ECG can help determine what damage may have been done to the heart muscle. For example, the ECG in a heart attack shows typical changes in the ST segments. An ECG in atrial fibrillation can show typical changes in the rhythm.
Interpreting the ECG is always done in context of what symptoms a patient has. Treatments are then offered depending upon this.
ECG changes after having stents placed in the blood carrying nerves?!
Thank you for you comment! We presume the changes you are asking about is what the changes in the ECG are after stents are placed in the arteries.
Normally, there are no real changes in the ECG after a stent is placed. The changes that are present on the ECG will be those that would have occurred before the stent was placed.These changes may persist or get better once a stent is placed.
Sometimes, if a stent gets blocked soon after it is deployed, it can lead to new ECG changes along with symptoms such as chest pain.